3D Charts: A Surface You Can Spin
Swift Charts gained a third axis in iOS 26. Plot an oven's heat as a surface, float a batch of cookie test bakes in a 3D scatter, and let the reader turn both with a finger.
- Serves
- iOS 26+ · iPhone, iPad and Mac
- Prep time
- 30 minutes
- Kitchen-tested
- Compiled with Xcode 26.6 · iOS 26.5 simulator · Oct 26, 2026
- Difficulty
- ★★☆
Chart3DSurfacePlotwith.foregroundStyle(.heightBased)PointMark(x:y:z:)with per-point colors.chart3DPose(_:)with aChart3DPosebinding.chart3DCameraProjection(_:).chartZScale(domain:)
Some data has three dimensions and a flat chart hides one of them. In iOS 26, Swift Charts adds Chart3D: the same declarative marks you know from 2D charts, plus a z axis, rendered in real 3D and rotatable with a drag.
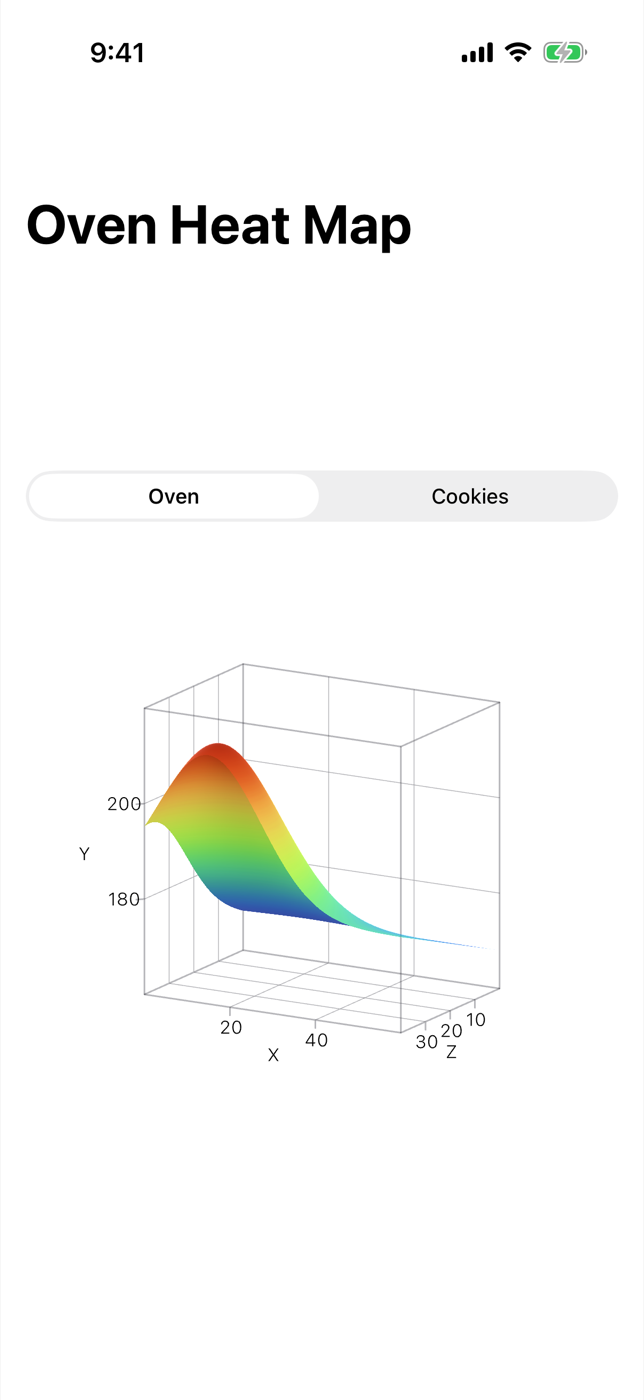
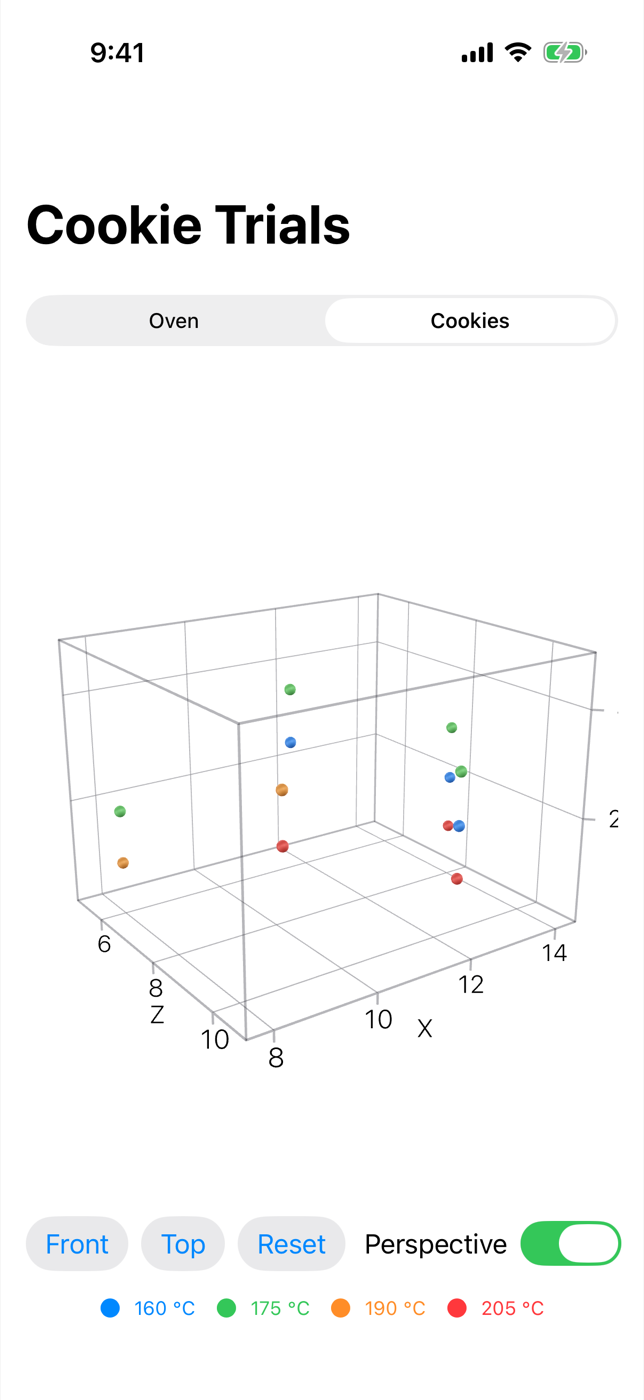
This recipe makes two dishes from the kitchen. One is a heat map of an oven rack as a 3D surface, showing the hot spot near the back element. The other is a scatter plot of cookie test bakes: bake time and dough thickness along the floor, taste rating as height, and oven temperature as color, with buttons to snap the camera to the front or top view.
Method
1. Set out the data
Chart3D lives in Charts, and the pose angles use Angle2D from Apple’s Spatial framework, so import both. The cookie data is twenty test batches, each with a taste score from 1 to 5. The scores are made up for the recipe, peaking around 11 minutes, 180 °C and 8 mm.
1
2
3
4
5
6
7
8
9
10
11
12
13
14
15
16
17
18
19
20
21
22
import Charts
import Spatial
import SwiftUI

struct CookieBatch: Identifiable {
    let id: Int
    let minutes: Double
    let temperature: Double
    let thickness: Double
    let rating: Int

    static let samples: [CookieBatch] = (0..<20).map { i -> CookieBatch in
        let minutes = 8 + Double(i % 5) * 1.5
        let temperature = 160 + Double(i / 5) * 15
        let thickness = 6 + Double((i * 3) % 5)
        let miss = abs(minutes - 11) / 1.5 + abs(temperature - 180) / 15 + abs(thickness - 8) / 2
        return CookieBatch(
            id: i, minutes: minutes, temperature: temperature, thickness: thickness,
            rating: max(1, 5 - Int(miss.rounded()))
        )
    }
}
2. Plot a surface
SurfacePlot draws a function of two variables. One detail to get right: in Swift Charts 3D, y is the vertical axis, so the function takes x and z and returns y. Here x and z are positions on a 60 by 40 cm oven rack and y is the temperature there, rising toward the back with a hot spot near the back-left corner.
.foregroundStyle(.heightBased) colors the surface by its y value, which makes the shape easy to read from any angle. Binding a Chart3DPose to .chart3DPose(_:) is all it takes to make the chart interactive: the reader drags to turn it.
1
2
3
4
5
6
7
8
9
10
11
12
13
14
15
16
17
18
struct OvenHeatMap: View {
    @State private var pose: Chart3DPose = .default

    var body: some View {
        Chart3D {
            SurfacePlot(x: "Width (cm)", y: "Temperature (°C)", z: "Depth (cm)") { x, z in
                let hotSpot = exp(-(pow(x - 15, 2) + pow(z - 35, 2)) / 300)
                return 168 + 0.3 * z + 35 * hotSpot
            }
            .foregroundStyle(.heightBased)
        }
        .chartXScale(domain: 0...60)
        .chartZScale(domain: 0...40)
        .chartYScale(domain: 160...220)
        .chart3DPose($pose)
        .aspectRatio(1, contentMode: .fit)
    }
}
Set all three scales explicitly, so the chart covers the rack’s real 60 by 40 cm and a fixed temperature range rather than whatever range the data happens to span. The .aspectRatio(1, contentMode: .fit) is there because, in our runs, a 3D chart given a tall space drew itself wider than the screen and lost its edges; constraining it to a square that fits the width keeps the whole box and its labels in view.
3. Scatter points in 3D
PointMark gains an init(x:y:z:) for 3D charts. Two lessons from the test kitchen shaped this one.
First, mind the proportions. In our simulator runs, Chart3D sized its box from the axis domains in their own units, so a first draft with temperature on the y axis (a 65-degree span) next to bake time (8 minutes) came out as a tall, thin column. Putting the taste rating on y instead gives three axes with similar spans (7, 6 and 5), and the best batches literally rise to the top.
Second, color. A 3D PointMark has .foregroundStyle(by:) like its 2D cousin, but in our runs, coloring by the numeric rating left every point the same blue. Setting each point’s color directly with .foregroundStyle(_:) works, and it lets temperature be the color here.
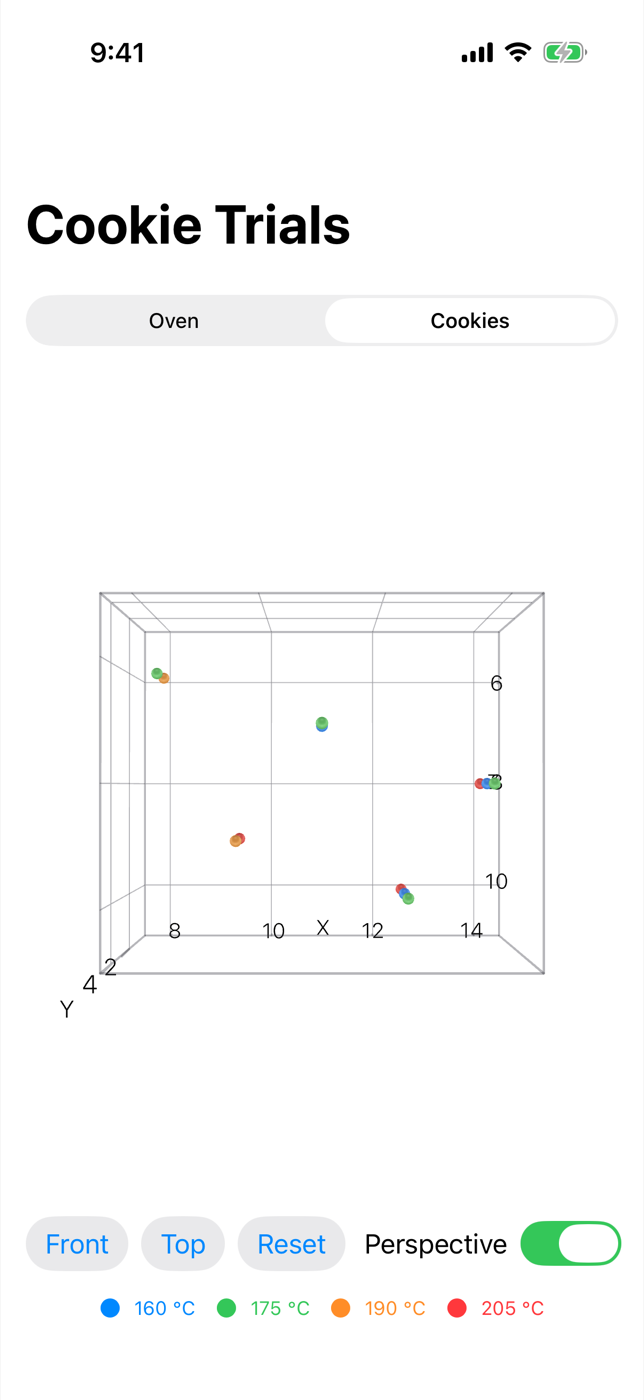
The pose doesn’t have to come from a drag. Chart3DPose has presets such as .front, .top and .default, plus init(azimuth:inclination:) for a custom angle. Setting it from a button jumps the camera, and the reader can still drag from there. The camera projection is a setting too: .perspective makes nearer points look bigger, and .orthographic keeps sizes constant, which makes it easier to compare positions along an axis.
1
2
3
4
5
6
7
8
9
10
11
12
13
14
15
16
17
18
19
20
21
22
23
24
25
26
27
28
29
30
31
32
33
34
35
36
37
38
39
40
41
42
43
44
45
46
47
48
49
50
struct CookieTrials: View {
    let batches: [CookieBatch]
    @State private var pose = Chart3DPose(azimuth: .degrees(35), inclination: .degrees(20))
    @State private var isPerspective = true

    var body: some View {
        VStack(spacing: 16) {
            Chart3D(batches) { batch in
                PointMark(
                    x: .value("Bake time (min)", batch.minutes),
                    y: .value("Rating", batch.rating),
                    z: .value("Thickness (mm)", batch.thickness)
                )
                .foregroundStyle(Self.color(for: batch.temperature))
            }
            .chartXScale(domain: 7.5...14.5)
            .chartYScale(domain: 0...5)
            .chartZScale(domain: 5...11)
            .chart3DPose($pose)
            .chart3DCameraProjection(isPerspective ? .perspective : .orthographic)

            HStack {
                Button("Front") { withAnimation { pose = .front } }
                Button("Top") { withAnimation { pose = .top } }
                Button("Reset") { withAnimation { pose = .default } }
                Spacer()
                Toggle("Perspective", isOn: $isPerspective)
                    .fixedSize()
            }
            .buttonStyle(.bordered)

            HStack(spacing: 12) {
                ForEach([160.0, 175, 190, 205], id: \.self) { temperature in
                    Label("\(Int(temperature)) °C", systemImage: "circle.fill")
                        .foregroundStyle(Self.color(for: temperature))
                }
            }
            .font(.caption)
        }
    }

    static func color(for temperature: Double) -> Color {
        switch temperature {
        case ..<170: .blue
        case ..<185: .green
        case ..<200: .orange
        default: .red
        }
    }
}
The row of labels under the chart is a hand-made legend, since the colors are set directly rather than through a scale.
4. Serve both on one screen
Dragging a 3D chart and scrolling a page fight over the same gesture, so don’t put these charts in a ScrollView. A segmented picker switches between them instead:
1
2
3
4
5
6
7
8
9
10
11
12
13
14
15
16
17
18
19
20
21
22
23
24
25
26
27
28
29
struct ChartsKitchenScreen: View {
    enum Dish: String, CaseIterable, Identifiable {
        case oven = "Oven"
        case cookies = "Cookies"
        var id: Self { self }
    }

    @State private var dish = Dish.oven

    var body: some View {
        NavigationStack {
            VStack(spacing: 20) {
                Picker("Chart", selection: $dish) {
                    ForEach(Dish.allCases) { dish in
                        Text(dish.rawValue).tag(dish)
                    }
                }
                .pickerStyle(.segmented)

                switch dish {
                case .oven: OvenHeatMap()
                case .cookies: CookieTrials(batches: CookieBatch.samples)
                }
            }
            .padding()
            .navigationTitle(dish == .oven ? "Oven Heat Map" : "Cookie Trials")
        }
    }
}
Plating
The oven opens on a colored surface tilted toward you: cool colors along the front of the rack, warming toward the back, and a peak in the back-left corner where the element runs hottest. Drag across it to turn the rack and look at the hot spot from other sides. Switch to Cookies and twenty points float in a box: the higher a point, the better that batch tasted, and the colors show which oven temperature it came from. Tap Top and the camera looks straight down at bake time against thickness; tap Reset to go back.
Kitchen notes
Chart3Dis available on iOS, iPadOS, macOS and visionOS 26, not on tvOS or watchOS.chart3DCameraProjectionis listed for iOS, iPadOS and macOS only, so leave it out of visionOS builds.- Apple’s documentation lists 3D initializers for
PointMark,RuleMarkandRectangleMark, alongside the 3D-onlySurfacePlot. - In our runs the axes were titled X, Y and Z, not with the names passed to
.valueorSurfacePlot. Say what each axis means in the text or a caption around the chart. .foregroundStyle(.normalBased)colors a surface by the direction it faces instead of its height, which helps when two surfaces overlap in the same chart.- A 3D chart is harder to read precisely than a 2D one. Pair it with a plain summary, or a 2D chart of the slice that matters, for readers who need exact values.
— 30 —
An In-App Browser, No UIKit Required
Use WebKit's new SwiftUI WebView and observable WebPage to build an in-app browser with history, progress and JavaScript.
Custom Animated Shapes with @Animatable
Build an animated batter gauge with a custom wave Shape, using the @Animatable macro, @AnimatableIgnored and PhaseAnimator.